$0.00
In stock
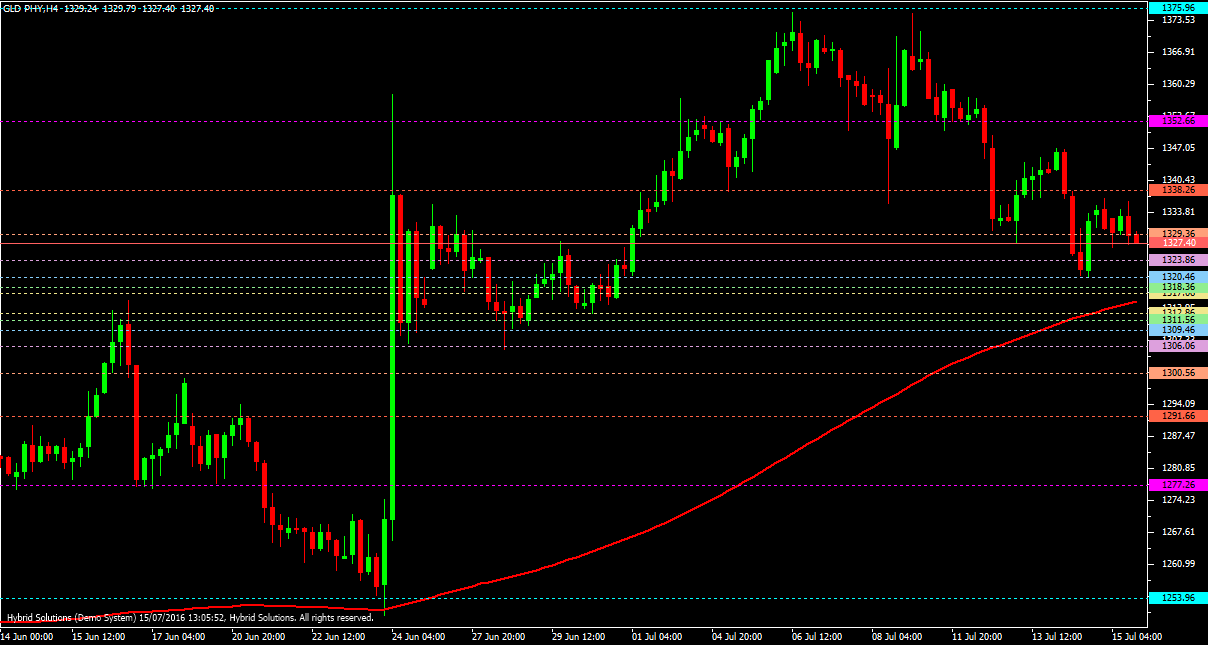
Critical Points is a handy VertexFX client side VTL indicator that support and resistance levels and trading ranges based on the trend and price movements.
As the name suggests, the indicator identifies the multiple support and resitance levels that are critical for trading, especially for placing of stop-loss and profit target.
(Downloads - 1890)

Critical Points is a handy VertexFX client side VTL indicator for support and resistance levels and trading ranges based on the trend and price movements.
Critical Points indicator identifies the multiple support and resitance levels that are critical for trading, especially for placing stop-loss and profit target. The concept behind the indicator is that prices exhibit certain critial price levels where an existing trend exhausts, or reverses. These levels are identified using Fibonacci series, and the levels below the current price form Support and the levels above the current price form Resistance. When trading LONG positions, supports can be used as stop-loss levels, and resistances can be used as target levels. Likewise, when trading SHORT positions, supports can be used as target levels, and the resistances can be used as stop-loss levels.
In the first step we calculate the Moving Average of the specified MA_TYPE and MA_PERIOD. In the next step we calculate the 8 Fibonacci levels above and below the Moving Average based on FIBO_1, FIBO_2, FIBO_3, FIBO_4, FIBO_5, FIBO_6, FIBO_7 and FIBO_8 distances provided by the user.
These levels are termed as Critical Points, as price exhibits support and resistance at these levels. For example, the immediate Support is the FIBO_1 level below, and the immediate Resistance is FIBO_1 level above.
When the FIBO_1 level is breached from above, that is the support is broken, it now becomes the resistance and the FIBO_2 below becomes the new support.
These Fibonacci levels are used to determine nearest support and resistances and place stop-losses or entry levels accordingly. In sideways markets, price bounces of support and falls down from resistances. When the support or resistance is broken with strong volume, it indicators the start of a new trend direction.
Note: This indicator does not provide Buy or Sell signals.
Note: It is preferred to use this indicator with H4 time frame
Usage
- Download the attachment from vStore or directly from the vStore tab in your terminal by performing a right click on it and selecting Download & Install
- Copy it to your company VertexFX Local VTL Files folder i.e. C:ProgramDataVertexFX Client Terminals”Company name”VTL10Local VTL Scripts
- Restart your Client Terminal or Right Click on “Local VTL Scripts” Tree Node to find the script.
Additional information
| Plugin-Type | Client VTL – Custom Indicator |
|---|---|
| Compatibility |

