$0.00
In stock
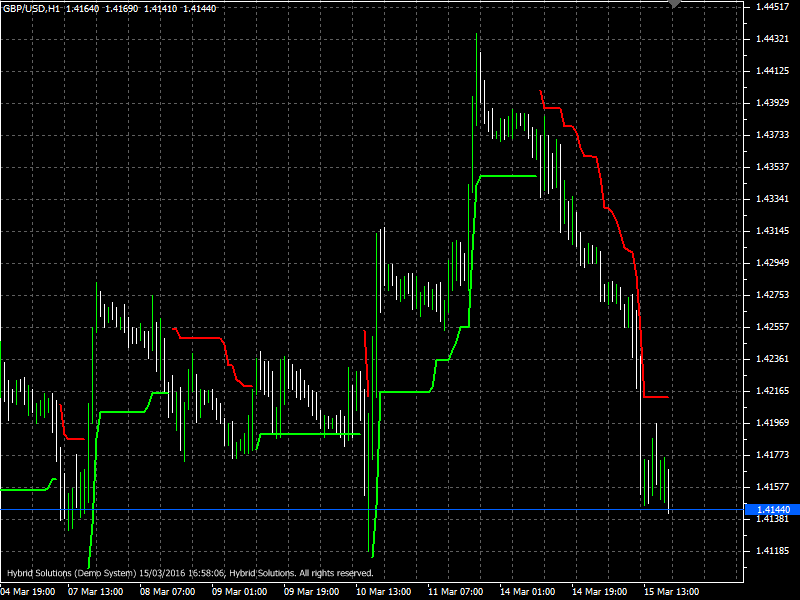
TrendValue is VertexFX client side VTL that is designed to determine the trend direction and provides a trend breakout trading strategy. It consists of 2 lines, red and green. Green line is the level of support and the Red line is the resistance level.
(Downloads - 1999)

TrendValue is VertexFX client side VTL that is designed to determine the trend direction and provides a trend breakout trading strategy. It consists of 2 lines, red and green. Green line is the level of support and the Red line is the resistance level.
Method of calculation of indicator:
TrendValue indicator is based on Simple Moving Average (SMA) and Average True Range (ATR). At first step, we calculate the SMA and ATR with given inputs. Next, we determine the level of support and resistance levels: resistance levels = SMA * (kRes+ATR * ATRSensitivity) support levels = SMA * (kSup-ATR * ATRSensitivity) kRes, kSup – Horizontal shear rate indicator.
Trading using indicator:
– Period – the period used in the moving average. For higher TF recommended to increase.
– ShiftPercent – shift indicator horizontally as a percentage.
– ATRPeriod – period of the ATR indicator, is used in the calculation.
– ATRSensitivity – shear sensitivity ATR.
Usage
- Download the attachment from vStore or directly from the vStore tab in your terminal by performing a right click on it and selecting Download & Install
- Copy it to your company VertexFX Local VTL Files folder i.e. C:ProgramDataVertexFX Client Terminals”Company name”VTL10Local VTL Scripts
- Restart your Client Terminal or Right Click on “Local VTL Scripts” Tree Node to find the script.
Additional information
| Plugin-Type | Client VTL – Custom Indicator |
|---|---|
| Compatibility |

