$0.00
In stock
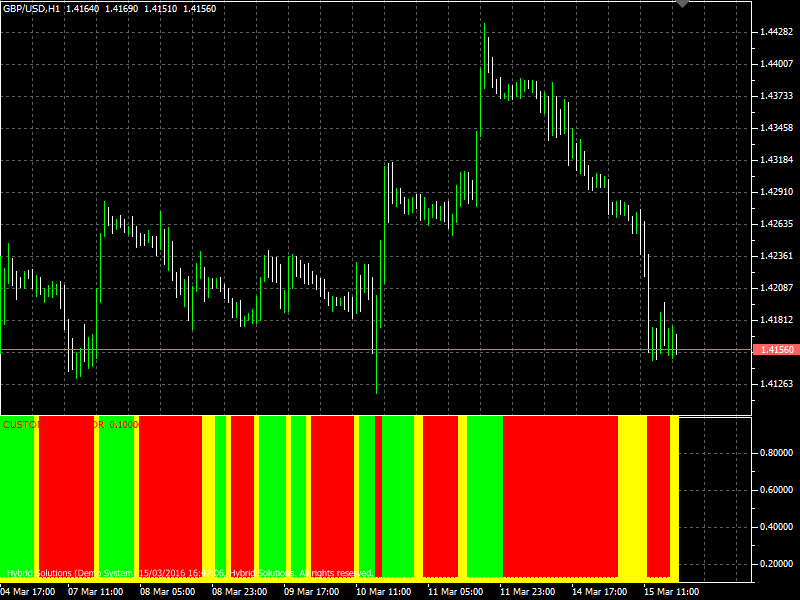
GG-RSI-CCI is a client side VTL indicator for the VertexFX, that combines two powerful indicators CCI and RSI. The relation between an average price and the current price is identified by CCI, while oversold and overbought condition is measured by RSI.
(Downloads - 1570)

GG-RSI-CCI is a client side VTL indicator for the VertexFX, that combines two powerful indicators CCI and RSI. The relation between an average price and the current price is identified by CCI, while oversold and overbought condition is measured by RSI.
Methodology of calculation:
1. First, we calculate the value of RSI array with Ind_Period and value of CCI array with Ind_Period.
2. Then we calculate the value of Simple Moving Average on RSI and CCI array with periods Avg_Period1 and Avg_Period2 (MA_RSI1, MA_RSI2,MA_CCI1, MA_CCI2, ).
3. if MA_RSI1 more than MA_RSI2 and MA_CCI1 more than MA_CCI2 then bearish trend is present. if MA_RSI1 less than MA_RSI2 and MA_CCI1 less than MA_CCI2 then bearish bearish is present. else is present Flete or “lateral movement”.
Trading using GG-RSI-CCI indicator:
Indicator GG-RSI-CCI informs traders about the current trend in the following way:
green histogram – bullish trend (Buy Signal), red histogram – bearish trend (Sell Signal), yellow histogram – Flete or “lateral movement”.
Usage
- Download the attachment from vStore or directly from the vStore tab in your terminal by performing a right click on it and selecting Download & Install
- Copy it to your company VertexFX Local VTL Files folder i.e. C:ProgramDataVertexFX Client Terminals”Company name”VTL10Local VTL Scripts
- Restart your Client Terminal or Right Click on “Local VTL Scripts” Tree Node to find the script.
Russian Version:
Индикатор состоит из 2 скользящих средних, популярный RSI и не менее распространенный индикатор CCI.
Принципы работы индикатора.
Индикатор GG—RSI—CCI информирует трейдера о текущем тренде следующим образом:
зеленая гистограмма — бычий тренд,
красная гистограмма — медвежий тренд,
желтая гистограмма — флет или «боковое движение».
Данный индикатор может легко настраиваться под конкретного трейдера или торговую систему.
Переменная Ind_Period отвечает за период индикаторов RSI и CCI, по умолчанию стоит 20. Переменные Avg_Period1 и Avg_Period2 отвечают за периоды скользящих средних, по умолчанию настроены на 8 и 14 соответственно.
Индикатор GG-RSI-CCI НЕ перерисовывает свои значения, а его основа из стандартных индикаторов с возможностью настройки дает нам почти готовую торговую систему в одном индикаторе.
При работе с этим индикатором желательно желательно учитывать показания индикатора на других таймфреймах.
Загрузите прикрепленный файл с сайта vStore.co или с панели vStore вашего терминала нажав правую кнопку мышки и выбрав Download & Install (Загрузить и установить).
Скопируйте вложение в директорию с установленным терминалом по следующему пути: C:ProgramDataVertexFX Client Terminals”Company name”VTL10Local VTL Scripts.
Перезагрузите VertexFX терминал или нажмите правой кнопкой мыши на “Локальные VTL – скрипты” а затем выберете пункт меню обновить. После этого, вы можете увидеть скрипт в перечне скриптов.
Additional information
| Plugin-Type | Client VTL – Custom Indicator |
|---|---|
| Compatibility |

