$0.00
In stock
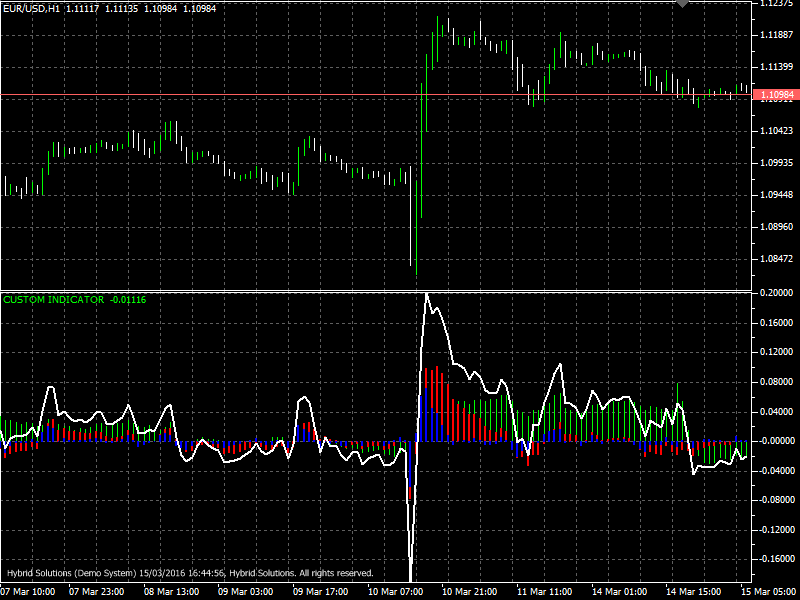
Force Momentum is a client side VertexFX indicator which consists of a main line of white color and three-histogram bars. Force Momentum indicator is a trend following indicator designed to determine the current trend.
The main white line is constructed using three moving averages with periods of 3, 14 and 50. The values of each of the moving averages are displayed as a bar graph with different colors (50MA – Green, 14MA – Red, 3MA – Blue). Histogram green color is determined by the moving average with a period equal to 3, the period of the red histogram is equal to 14 and the period of the blue histogram is 50.
(Downloads - 1686)

Force Momentum is a client side VertexFX indicator which consists of a main line of white color and three-histogram bars. Force Momentum indicator is a trend following indicator designed to determine the current trend.
The main white line is constructed using three moving averages with periods of 3, 14 and 50. The values of each of the moving averages are displayed as a bar graph with different colors (50MA – Green, 14MA – Red, 3MA – Blue). Histogram green color is determined by the moving average with a period equal to 3, the period of the red histogram is equal to 14 and the period of the blue histogram is 50.
Trading using the indicator:
A signal to sell is when the indicator line moves down and is below 0, then the market is in downtrend. A signal to buy when the indicator line moves up and is above the zero level.
The use of the indicator.
The indicator can be used on any time frames. It can be applied as a filter as well as for trade. When you open a transaction, it is desirable that all three color histograms have the same direction. A good signal to buy is the situation when the white indicator line breaks through the zero level rises above, falls below, and is reflected from the zero level. Accordingly, a good sign for sell is a break through the zero level from top to bottom and then reflected from this level.
Russain version:
Этот форекс индикатор строиться в отдельном окно терминала и состоит из основной линии индикатора белого цвета и трехцветной гистограммы.
Данный индикатор является трендовым индикатором, он предназначен для определения текущего тренда.
Основная линия белого строится с использованием трех скользящих средних с периодами 3, 14 и 50. Значения каждой из скользящих средних отображаются в виде гистограммы с различными цветами. Гистограмма зеленного цвета определяется значением скользящей средней с периодом равным 3, период красной гистограммы равен 14 и период синей гистограммы равен 50.
Торговые сигналы..
Сигналом для продажи является ситуация, когда линия индикатора движется вниз и находится ниже уровня 0, тогда рынке присутствует нисходящий тренд.
Сигналом для покупки является ситуация когда линия индикатора движется вверх и находится выше нулевого уровня.
Применение индикатора:
Индикатор можно использовать на любых таймфреймах. Он может применятся в роли фильтра а также для торговли. При открытии сделок желательно что бы все три цвета гистограммы имели одинаковое направление.
Хорошим сигналом для покупки является ситуация когда белая линия индикатора пробивает нулевой уровень подымается выше, далее опускается и отражается от нулевого уровня. Соответственно хорошим сигналом для продажи является пробитие нулевого уровня сверху вниз и далее отражение от этого уровня.
Загрузите прикрепленный файл с сайта vStore.co или с панели vStore вашего терминала нажав правую кнопку мышки и выбрав Download & Install (Загрузить и установить).
Скопируйте вложение в директорию с установленным терминалом по следующему пути: C:ProgramDataVertexFX Client Terminals”Company name”VTL10Local VTL Scripts.
Перезагрузите VertexFX терминал или нажмите правой кнопкой мыши на “Локальные VTL – скрипты” а затем выберете пункт меню обновить. После этого, вы можете увидеть скрипт в перечне скриптов.
Additional information
| Plugin-Type | Client VTL – Custom Indicator |
|---|---|
| Compatibility |

