$0.00
In stock
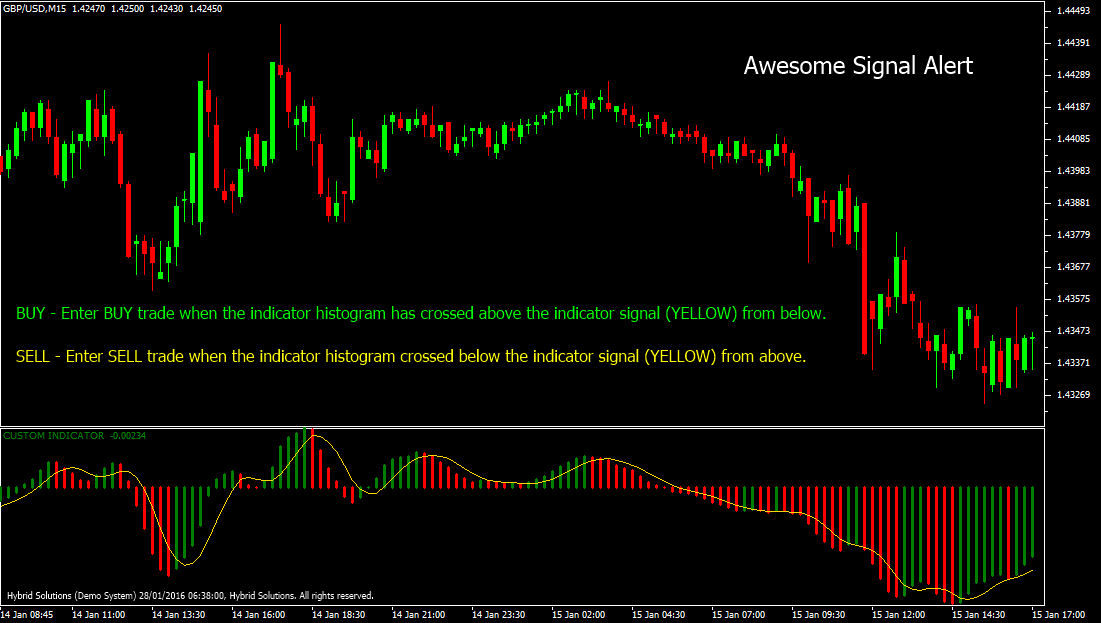
Awesome Signal Alert is a powerful VertexFX client-side oscillator that provides excellent cyclical signals based upon the Awesome Oscillator.
(Downloads - 1857)

Awesome Signal Alert is a powerful VertexFX client-side oscillator that provides excellent cyclical signals based upon the Awesome Oscillator.
This indicator is an unbounded oscillator with the zero level as the centre line. The indicator has three components, the bullish component (Green), the bearish component (Red) and the signal component (Yellow). When the bullish component (Green) is below zero and slowing increasing, it implies a strong change in trend from bearish to bullish. When the bearish component (Red) is above zero and slowing decreasing, it implies that a strong change in trend from bullish to bearish. The signal component (Yellow) is used to generate the entry Buy and Sell signals for trading. This indicator uses the Median price (which is average of High and Low prices).
In the first step, we calculate the Median price for each candle. In the second step, we calculate the Simple Moving Average (SMA) of the Median price over the AO FAST period and AO SLOW period. In the third step, we subtract the AO SLOW period SMA from the AO FAST period SMA. This is the Awesome Oscillator. This difference calculated in the third step is rendered in Green (bullish) if it is rising, and rendered in Red (bearish) if it is falling. The signal component (Yellow) is calculated by computing the Simple Moving Average (SMA) of the Awesome Oscillator over the recent AO SIGNAL bars.
| Buy | Place Buy position when the indicator histogram has crossed above the indicator signal (Yellow) from below. The indicator histogram can be Red or Green. However, if the indicator histogram is Green then it implies that the bullish trend is very strong. It is preferable that both the indicator histogram and the signal are below the zero line. Do not open Buy trade if the candle has a gap-up opening. Place stop-loss below the nearest Swing Low level. |
| SELL | Place Sell position when the indicator histogram crossed below the indicator signal (Yellow) from above. The indicator histogram can be Red or Green. However, if the indicator histogram is Red then it implies that the bearish trend is very strong. It is preferable that both the indicator histogram and the signal are above the zero line. Do not open Sell trade if the candle has a gap-down opening. Place stop-loss above the nearest Swing High level. |
Usage
- Download the attachment from vStore or directly from the vStore tab in your terminal by performing a right click on it and selecting Download & Install
- Copy it to your company VertexFX Local VTL Files folder i.e. C:ProgramDataVertexFX Client Terminals”Company name”VTL10Local VTL Scripts
- Restart your Client Terminal or Right Click on “Local VTL Scripts” Tree Node to find the script.
Additional information
| Plugin-Type | Client VTL – Custom Indicator |
|---|---|
| Compatibility |

