$0.00
In stock
Perry Kaufman AMA optimized indicator is a powerful VertexFX client-side trend-following indicator that provides excellent signals in trending markets. Perry Kaufman, is an Adaptive Moving Average (AMA), whereby the period of the Moving Average is calculated by determining the market cycle. The original indicator was developed by Perry Kaufman, and this indicator is an optimized version of the same.
(Downloads - 1544)

Perry Kaufman AMA optimized indicator is a powerful VertexFX client-side trend-following indicator that provides excellent signals in trending markets. Perry Kaufman, is an Adaptive Moving Average (AMA), whereby the period of the Moving Average is calculated by determining the market cycle. The original indicator was developed by Perry Kaufman, and this indicator is an optimized version of the same.
The drawback of calculating moving averages using fixed periods is that they are not responsive to market cycles. When the market is sideways and exhibits whipsaws, the moving averages lose accuracy. Similarly, when the market is exhibiting strong trend the indicator exhibits lag after certain bars. This problem is solved using an Adaptive Moving Average (AMA). The Perry Kaufman AMA Optimized indicator is calculated as follows:
At first step, we calculate the absolute change in the price. The price field is defined by the PRICE_TYPE input parameter. In the second step, the noise is calculated as a simple moving average of the absolute change in price (calculated in previous step). This value is multiplied by the AMA PERIOD. The current price is subtracted from the price AMA_PERIOD bars ago, and the absolute value of this difference is divided by the Noise calculated in the previous step. In the fourth step, the Adaptive Moving Average smoothing constant is calculated by computing the G-th power of the product of the value calculated in the third step. Finally, the Perry Kaufman AMA optimized value is calculated by multiplying the price with the value calculated in the fourth step. This value is smoothed using the smoothing constant G once again to derive the final Perry Kaufman AMA value.
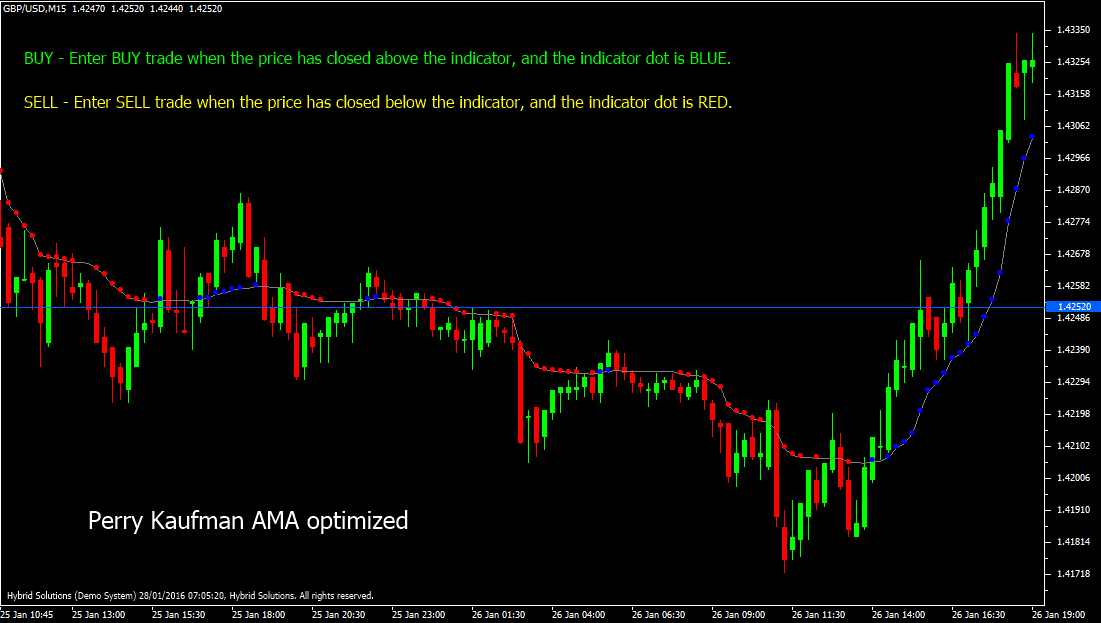
The Brown line represents the main indicator, which is the Perry Kaufman AMA optimized indicator. The Blue dots on the indicator line imply bullish trends and the Red dots on the indicator line imply bearish trends. When the indicator value rises by atleast dK points, it implies that a strong bullish trend is possible, and hence a Blue dot is marked on that bar. Similarly, when the indicator value falls by alteast dK points, it implies that a strong bearish trend is possible, and hence a Red dot is marked on that bar.
| BUY |
Place Buy trade when the price has closed above the indicator, and the indicator dot is Blue. Do not open Buy trade if the candle has a gap-up opening. Place stop-loss below the nearest Swing Low level. |
| SELL |
Place Sell trade when the price has closed below the indicator, and the indicator dot is Red. Do not open Sell trade if the candle has gap-down opening. Place stop-loss above the nearest Swing High level. |
Usage
- Download the attachment from vStore or directly from the vStore tab in your terminal by performing a right click on it and selecting Download & Install
- Copy it to your company VertexFX Local VTL Files folder i.e. C:ProgramDataVertexFX Client Terminals”Company name”VTL10Local VTL Scripts
- Restart your Client Terminal or Right Click on “Local VTL Scripts” Tree Node to find the script.
Additional information
| Plugin-Type | Client VTL – Custom Indicator |
|---|---|
| Compatibility |

