$0.00
In stock
RSX indicator is a powerful VertexFX client-side oscillator that identifies market cycles and reversals in market trends. It is used in conjunction with other indicators to provide entry and exit signals. The concept behind the RSX indicator is the method applied to calculate the Relative Strength Index (RSI). Unlike RSI, which uses closing prices, this indicator uses High and Low prices. Additional smoothing is applied, and the lag is removed to provide fast response to change in direction.
(Downloads - 2014)

RSX indicator is a powerful VertexFX client-side oscillator that identifies market cycles and reversals in market trends. It is used in conjunction with other indicators to provide entry and exit signals. The concept behind the RSX indicator is the method applied to calculate the Relative Strength Index (RSI). Unlike RSI, which uses closing prices, this indicator uses High and Low prices. Additional smoothing is applied, and the lag is removed to provide fast response to change in direction.
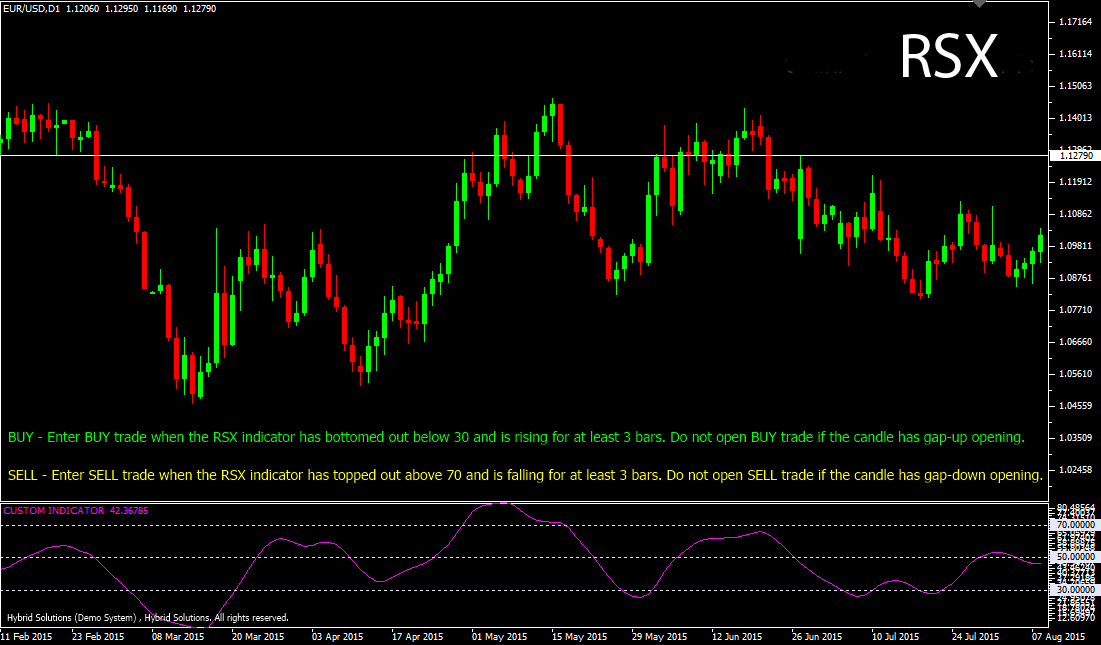
The RSX indicator is an oscillator within the range of 0 to 100. When the indicator values are low (below 30), the market is considered oversold. Similarly, when the indicator value is high (above 70), the market is considered overbought. In the first step, we calculate the range between the High and the Low values. This value is then smoothed over the recent LENGTH bars using the smoothing factor. The smoothing factor is calculated by dividing 3 (three) with the sum of LENGTH and 2 (LENGTH + 2).
In the next step, we calculate the RSX using the relative strength over the recent LENGTH periods. The Relative Strength is calculated by dividing the sum of up-closes by the sum of down closes. When the market is trending up, the RSX value gradually rises. When the market exhibits weakness and tops out, the value of RSX tops out and starts falling. On the contrary, when the market is trending down, the RSX value falls gradually. Finally, when the market bottoms out and exhibits strength, the value of RSX also bottoms out and starts rising. These identify the turning points in the market.
| BUY |
Place Buy trade when the RSX indicator has bottomed out below 30 and is rising for at least 3 bars. Do not open buy trade if the candle has gap-up opening. Place stop-loss below the nearest Swing Low level. |
| SELL |
Place Sell trade when the RSX indicator has topped out above 70 and is falling for at least 3 bars. Do not open sell trade if the candle has gap-down opening. Place stop-loss above the nearest Swing High level. |
Usage
- Download the attachment from vStore or directly from the vStore tab in your terminal by performing a right click on it and selecting Download & Install
- Copy it to your company VertexFX Local VTL Files folder i.e. C:ProgramDataVertexFX Client Terminals”Company name”VTL10Local VTL Scripts
- Restart your Client Terminal or Right Click on “Local VTL Scripts” Tree Node to find the script.
Additional information
| Plugin-Type | Client VTL – Custom Indicator |
|---|---|
| Compatibility |

