$0.00
In stock
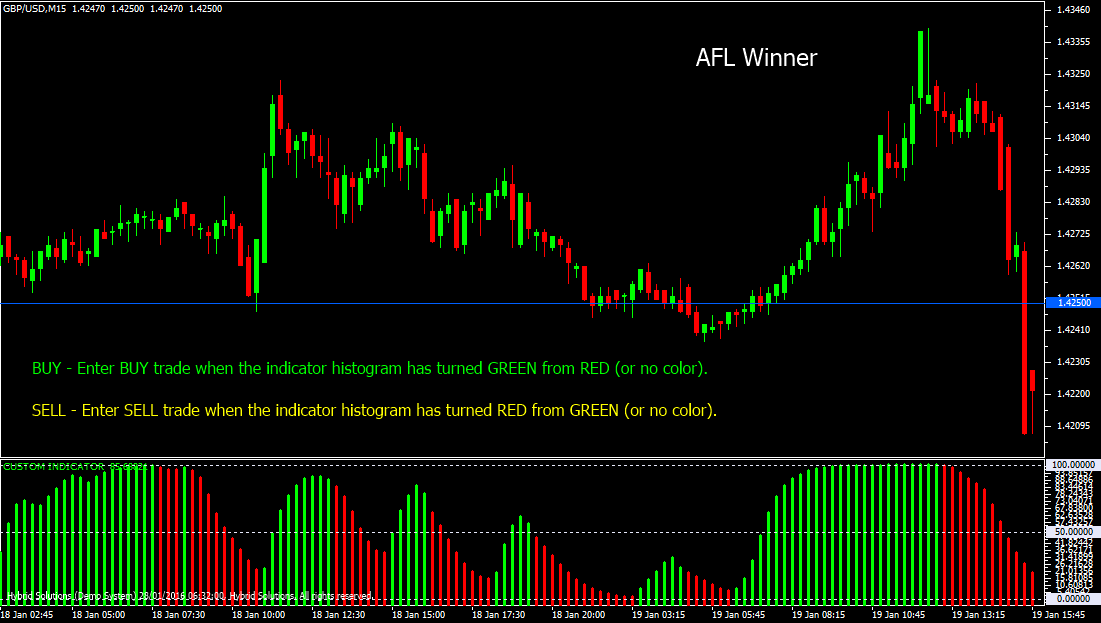
AFL Winner indicator is a powerful Vertex FX client-side oscillator that provides excellent short-term signals, especially when the market direction has changed or about to change. This indicator is a bounded oscillator with a range of 0 to 100. The stronger the indicator value, the stronger is the strength of the trend.
(Downloads - 1583)

AFL Winner indicator is a powerful Vertex FX client-side oscillator that provides excellent short-term signals, especially when the market direction has changed or about to change. This indicator is a bounded oscillator with a range of 0 to 100. The stronger the indicator value, the stronger is the strength of the trend.
The indicator has two components, the Bullish component (Green) and the Bearish component (Red). The Bullish component implies that the trend is bullish, and the Bearish component implies that the trend is bearish. In the first step, we calculate the weighted price, which is the sum of High, Low and Close multiplied by two. This value is divided by four to derived the Weighted price. In the next step, we calculate the Linear Weighted Moving Average (LWMA) of the weighted price calculated in the previous step. The LWMA is calculated over the recent AVERAGE bars. In the third step, the Highest High and the Lowest Low of the LWMA price (calculated in the previous step) is identified over the recent PERIOD bars.
In the fourth step, we calculate the relative strength – whereby the lowest low is subtracted from the LWMA value. This difference is first divided by the difference of the Highest High of the LWMA and the Lowest Low of the LWMA, and then multiplied by 100 to normalize it over a scale of 0 to 100.In the fifth step, the Exponential Moving Average (EMA) is calculated of this relative strength. In the sixth step, once again the Exponential Moving Average (EMA) is calculate of the EMA calculated in the fifth step. These values provide us with the Bullish and Bearish components of the indicator. If the EMA calculated in fifth step is greater than the EMA calculated in the sixth step, the indicator is Bullish, whereas if it is lesser then the indicator is Bearish.
| BUY |
Place Buy trade when the indicator histogram has turned Green from Red (or no color). Do not open Buy trade if the candle has a gap-up opening. Place stop-loss below the nearest Swing Low level. |
| SELL | Place Sell trade when the indicator histogram has turned Red from Green (or no color). Do not open Sell trade if the candle has gap-down opening. Place stop-loss above the nearest Swing High level. |
Usage
- Download the attachment from vStore or directly from the vStore tab in your terminal by performing a right click on it and selecting Download & Install
- Copy it to your company VertexFX Local VTL Files folder i.e. C:ProgramDataVertexFX Client Terminals”Company name”VTL10Local VTL Scripts
- Restart your Client Terminal or Right Click on “Local VTL Scripts” Tree Node to find the script.
Additional information
| Plugin-Type | Client VTL – Custom Indicator |
|---|---|
| Compatibility |

