$0.00
In stock
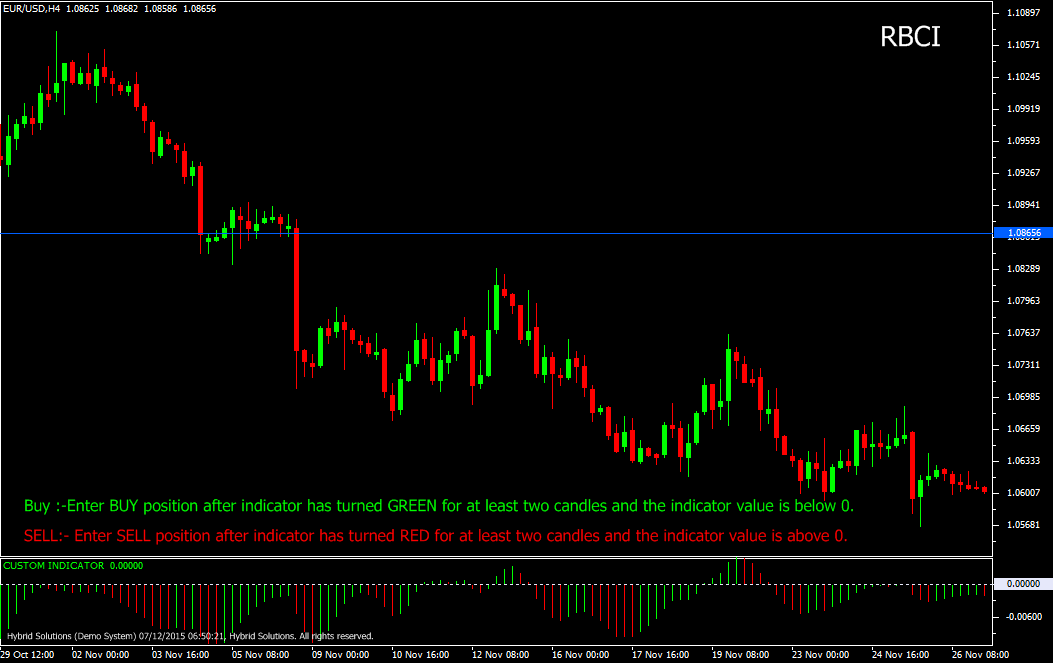
RBCI (Range Bound Channel Index) Histogram is a VertexFX Client Side VTL based on the Fast Adaptive Trendline (FATL) and Slow Adaptive Trend line (SATL) indicators, and useful for determining market turning points. In Digital Signal Processing theory, prices are considered to be based of two components – the signal component – which is the main trend, and the noise component – which is the whipsaws and sideways movements. The RBCI indicator attempts to eliminate the noise component and refine the main trend component. The close of each candle is multiplied by a filter smoothing co-efficient, and the sum of this value is calculated over the recent 80 bars to derive the RBCI histogram indicator value. These smoothing co-efficient are weighted based on digital filter probabilities.
(Downloads - 1501)

RBCI (Range Bound Channel Index) Histogram is a VertexFX Client Side VTL based on the Fast Adaptive Trendline (FATL) and Slow Adaptive Trend line (SATL) indicators, and useful for determining market turning points. In Digital Signal Processing theory, prices are considered to be based of two components – the signal component – which is the main trend, and the noise component – which is the whipsaws and sideways movements. The RBCI indicator attempts to eliminate the noise component and refine the main trend component. The close of each candle is multiplied by a filter smoothing co-efficient, and the sum of this value is calculated over the recent 80 bars to derive the RBCI histogram indicator value. These smoothing co-efficient are weighted based on digital filter probabilities.
However, unlike the basic RBCI indicator, the values are further smoothed over 25 bars and this difference is presented as the RBCI Histogram. RBCI Histogram requires at least 80 bars since it is based upon FATL and SATL which require 55 bars. Further smoothing of 25 bars is performed hence the total number of bars required is 80. It is calculated by subtracting SATL from FATL. Prices approach the extreme range when RBCI its local maximum (or minimum) price. This implies that RBCI is an excellent indicator that can be used to determine the extreme ranges, and the levels from which the markets can turn. It is a zero based unbounded oscillator. A rising value of RBCI indicates an uptrend, whereas a falling value indicators a downtrend.
The difference between the RBCI and its 25 bar moving average is represented as the RBCI histogram. When the indicator value is falling, the color of histogram is displayed in RED. When the value of the indicator is rising, the color of the histogram is displayed in GREEN.
Buy: Enter BUY position after indicator has turned GREEN for at least two candles and the indicator value is below 0. Do not enter BUY trade if price has gap-up opening.
Sell: Enter SELL position after indicator has turned RED for at least two candles and the indicator value is above 0. Do not enter SELL trade if price has gap-down opening.
Usage
- Download the attachment from vStore or directly from the vStore tab in your terminal by performing a right click on it and selecting Download & Install
- Copy it to your company VertexFX Local VTL Files folder i.e. C:ProgramDataVertexFX Client Terminals”Company name”VTL10Local VTL Scripts
- Restart your Client Terminal or Right Click on “Local VTL Scripts” Tree Node to find the script.
Additional information
| Plugin-Type | Client VTL – Custom Indicator |
|---|---|
| Compatibility |

