$0.00
In stock
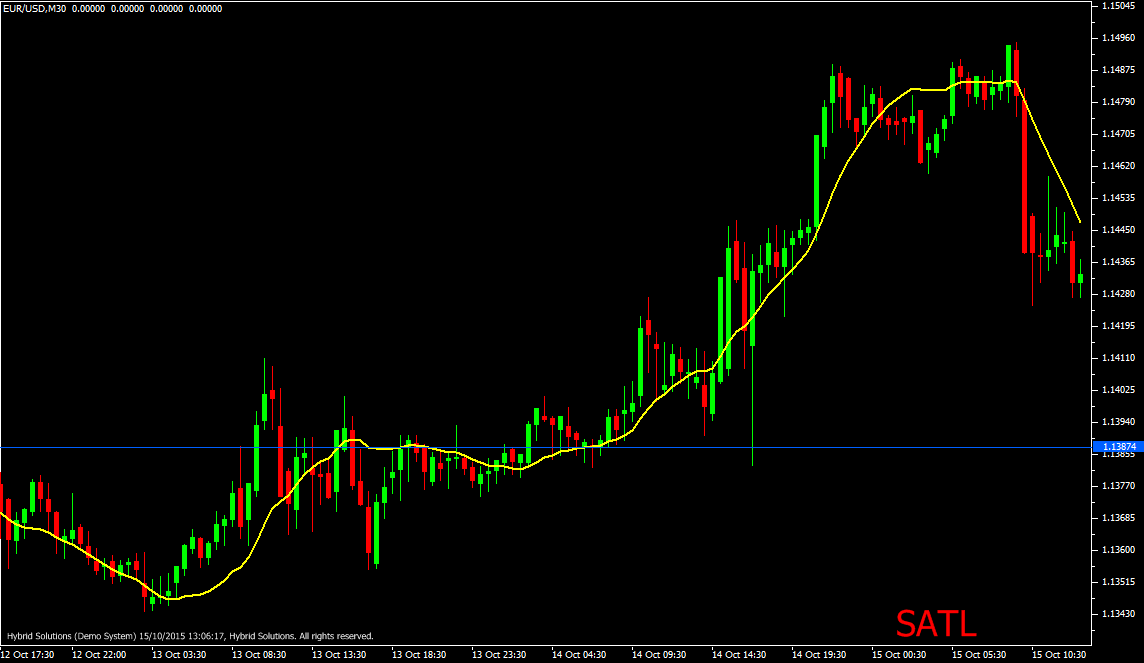
SATL (Slow Adaptive Trend Line) is a VertexFX client side VTL indicator used to determine trending markets and specifically for trend following systems.
It employs digital filter, mainly the low frequency FLF-2 filter. In Digital Signal Processing theory, prices are considered to be based of two components – the signal component – which is the main trend, and the noise component – which is the whipsaws and sideways movements. The SATL indicator attempts to eliminate the noise component and refine the main trend component.
(Downloads - 1617)

SATL (Slow Adaptive Trend Line) is a VertexFX client side VTL indicator used to determine trending markets and specifically for trend following systems.
It employs digital filter, mainly the low frequency FLF-2 filter. In Digital Signal Processing theory, prices are considered to be based of two components – the signal component – which is the main trend, and the noise component – which is the whipsaws and sideways movements. The SATL indicator attempts to eliminate the noise component and refine the main trend component.
Comparing to moving averages, SATL reduces lag and hence catches trends early on. SATL indicator requires at least 64 bars, and is calculated using the FLF-2 co-efficient over a 64 bar period. The close of each candle is multiplied by a filter smoothing co-efficient, and the sum of this value is calculated over the recent 64 bars to derive the SATL indicator value. These smoothing co-efficient are weighted based on digital filter probabilities.
The concept behind SATL and similar category of DSP based indicators is that upwards or downwards or even minor sideways movements cancel each other out, and what remains is the trend. If the trend is moving upwards, then SATL will be moving upwards as well, whereas when the trend is moving downwards then the SATL will move downwards. When the trend is sideways, SATL will be sideways.
BUY – Place Buy position when candle closes above SATL. Place StopLoss (SL) at nearest support below SATL. Do not place Buy trade if candle gaps up above SATL.
SELL – Place Sell position when candle closes below SATL. Place StopLoss (SL) at nearest resistance below SATL. Do not place Sell trade if candle gaps down below SATL.
Usage
- Download the attachment from vStore or directly from the vStore tab in your terminal by performing a right click on it and selecting Download & Install
- Copy it to your company VertexFX Local VTL Files folder i.e. C:Program FilesCompany Namevtl10Local VTL Files
- Restart your Client Terminal or Right Click on “Local VTL Scripts” Tree Node to find the script.
Additional information
| Plugin-Type | Client VTL – Custom Indicator |
|---|---|
| Compatibility |

