$0.00
In stock
Optimum Predictor is a VertexFX Indicator that predicts market turning points based on historical data with a high degree of accuracy.
(Downloads - 1416)

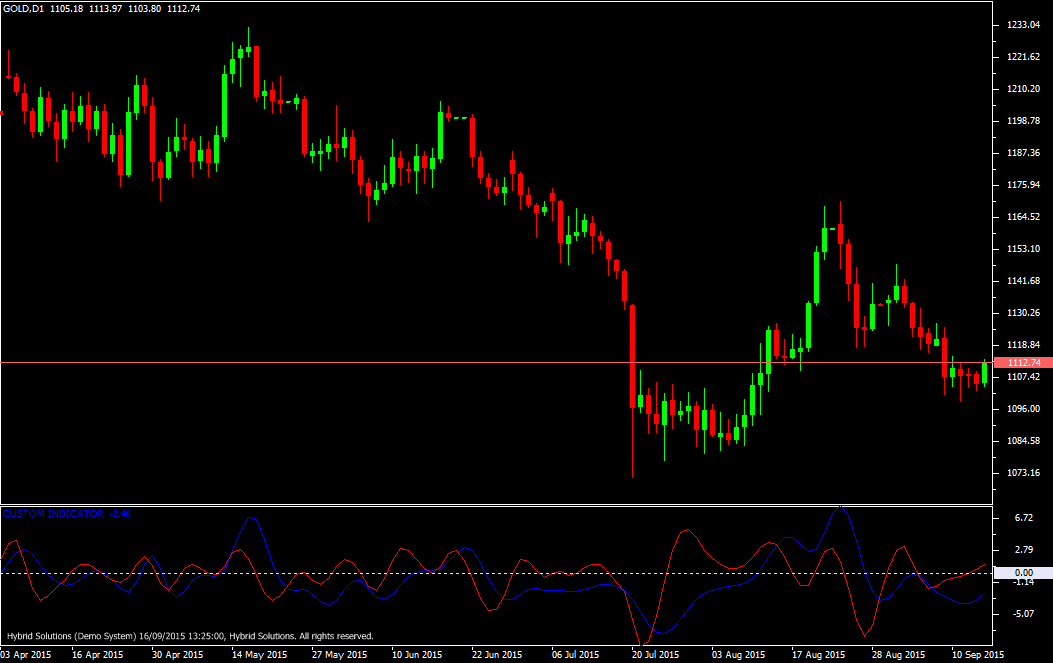
Optimum Predictor is a VertexFX Indicator that predicts market turning points based on historical data with a high degree of accuracy. This indicator comprises of two lines, the Blue Signal line, and the Red Predict line. It is the Red Predict line which identifies the turning points. At first we calculate InPhase and Quadrature components using Hilbert Transform after smoothing the price with a 4-bar WMA. In next step we calculate the dominant cycle period using the Homodyne period. In the next step we calculate the de-trended EMA based on this period. Finally, the Predict signal (Red) is calculated by subtracting the difference between the de-trended EMA and the smoothed Signal (Blue).
NOTE – The Signal (Blue) line is purely for reference only, and not for generating trading signals. Only the Predict (Red) line is used for trading reference.
BUY – Place Buy when Red line is falling and has bottomed out below zero level. Exit Buy when the Red line is rising and has topped out above the zero level.
SELL – Place Sell when Red line is rising and has topped out above zero level. Exits Sell when Red line is falling and has bottomed out below the zero level.
Usage
- Download the attachment.
- Copy it to your company VertexFX Local VTL Files folder i.e. C:Program FilesCompany Namevtl10Local VTL Scripts
- Restart your Client Terminal or Right Click on “Local VTL Scripts” Tree Node to find the script.
Additional information
| Plugin-Type | Client VTL – Custom Indicator |
|---|---|
| Compatibility |

