$0.00
In stock
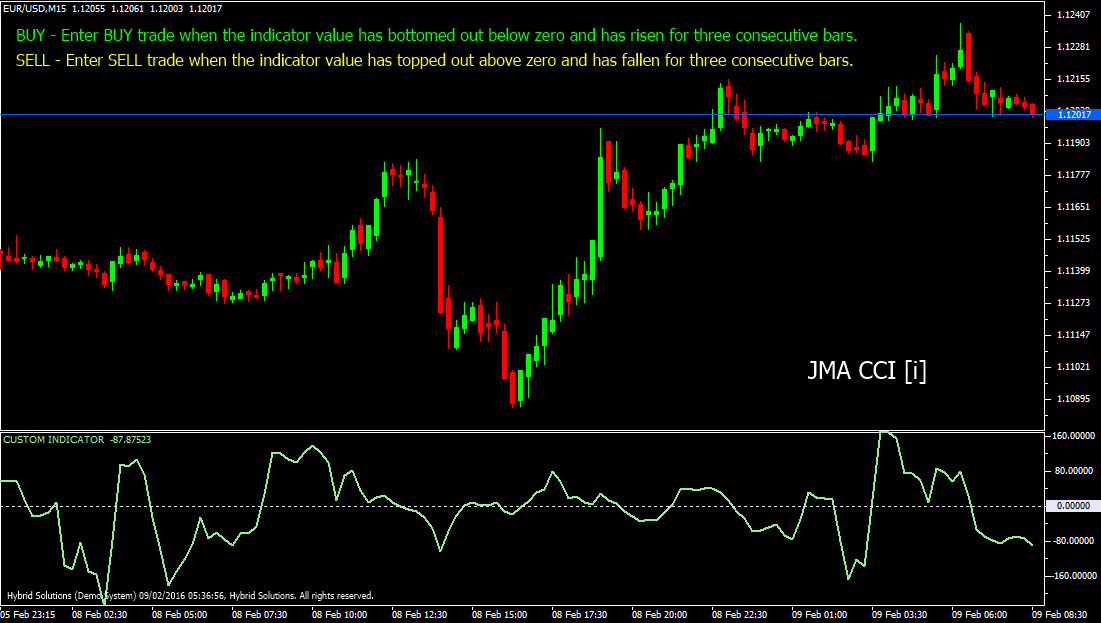
JMA CCI [I] indicator is a powerful VertexFX client-side trend-following indicator that provides excellent insights into the current trend of the market and generates precise entry and exit signals. JMA CCI is based on the Jurik Moving Average (JMA) and the Commodity Channel Index (CCI). As a result, it combines the powerful features of both the indicators. It is an unbounded oscillator with a zero center line, that is calculated using the Commodity Channel Index (CCI) function on the Jurik Moving Average (JMA).
(Downloads - 1500)

JMA CCI [I] indicator is a powerful VertexFX client-side trend-following indicator that provides excellent insights into the current trend of the market and generates precise entry and exit signals. JMA CCI is based on the Jurik Moving Average (JMA) and the Commodity Channel Index (CCI). As a result, it combines the powerful features of both the indicators. It is an unbounded oscillator with a zero center line, that is calculated using the Commodity Channel Index (CCI) function on the Jurik Moving Average (JMA).
We first calculate the Jurik Moving Average (JMA), and then calculate the Commodity Channel Index (CCI) on that value. The Jurik Moving Average (JMA) is a specially designed moving average that adapts dynamically to the market condition to generate the moving average. Unlike most of the moving average methods which are static, where the period does not change, the JMA uses the reference JMA LENGTH as the starting point to calculate the moving averages. It then detects the market cycles to adapt itself, and then dynamically computes the period used to calculate the moving average. A market cycle (which starts from a bottom to top, or vice versa) is made of amplitude and phase. The amplitude is the strength of the signal, and phase is the duration of the signal.
At first step, we calculate the change in closing prices of the recent JMA LENGTH period. In the second step, the log-normal returns of the absolute change in the closing prices is calculated. In the next step, we calculate the standard deviation from the previous step. Based on the previous step, we calculate the phase cycle of the standard deviation. We now calculate the Jurik Moving Average (JMA) by normalizing the price and the standard deviation calculated from the previous step. In the next step we calculate the absolute difference between the Typical Price (average of High, Low and Close price), and the Jurik Moving Average. The average of this value over the recent CCI PERIOD bars is computed. We again subtract this value from the Typical price over the recent CCI PERIOD bars, and divide the result by the Jurik Moving Average (JMA). This result is the JMA CCI.
| BUY |
Place Buy trade when the indicator value has bottomed out below zero and has risen for three consecutive bars. Do not place Buy trade if the candle has a gap-up opening. Place stop-loss below the nearest Swing Low level. |
| SELL |
Place Sell trade when the indicator value has topped out above zero and has fallen for three consecutive bars. Do not place Sell trade if the candle has gap-down opening. Place stop-loss above the nearest Swing High level. |
Additional information
| Plugin-Type | Client VTL – Custom Indicator |
|---|---|
| Compatibility |

