$0.00
In stock
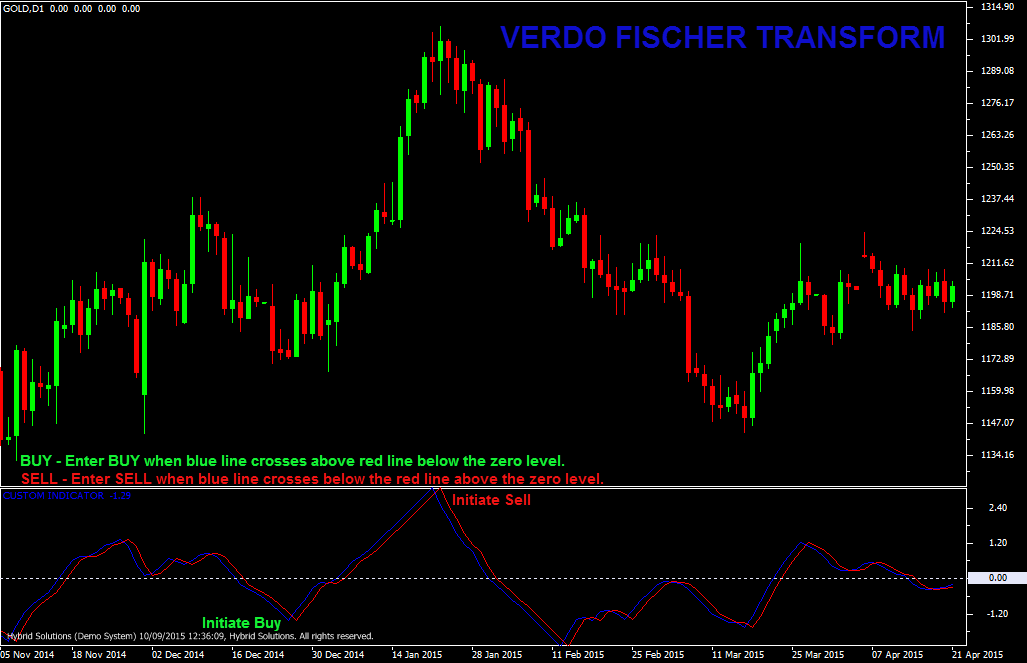
Fischer Transform is a powerful VertexFX indicator to detect extreme price movements and turning points.
(Downloads - 1436)

Fischer Transform is a powerful VertexFX indicator to detect extreme price movements and turning points.
The turning points can be clearly and unambiguously detected. It is a statistical indicator that converts any input (prices) probability distribution to be nearly a gaussian probability distribution. It comprises of two indicators, the main (Blue) signal and the trigger (Red) signal. To calculate the Fisher Transform, we first find the Highest and Lowest median prices of the recent time candles. We then calculate the ratio of the current price with respect to this range. Finally the Fisher Transform is calculated as 0.25 * LOG ((1+ratio)/(1-ratio) ) + 0.5 * Previous Fisher. The Fisher Transform can also be used with the MACD indicator to determine the change in market direction.
BUY – Place Buy position when blue line crosses above red line below the zero level.
SELL – Place Sell position when blue line crosses below the red line above the zero level.
Usage
- Download the attachment.
- Copy it to your company VertexFX Local VTL Files folder i.e. C:Program FilesCompany Namevtl10Local VTL Scripts
- Restart your Client Terminal or Right Click on “Local VTL Scripts” Tree Node to find the script.
Usage
- Download the attachment.
- Copy it to your company VertexFX Local VTL Files folder i.e. C:Program FilesCompany Namevtl10Local VTL Scripts
- Restart your Client Terminal or Right Click on “Local VTL Scripts” Tree Node to find the script.
Additional information
| Plugin-Type | Client VTL – Custom Indicator |
|---|---|
| Compatibility |

