$0.00
In stock
Sine wave indicator is a VertexFX handy indicator for detecting cyclical markets and turning points.
Reckoning of cyclic defining moments is a noteworthy point of preference of Sine wave Indicator when contrasted with different oscillators, for example, the RSI and Stochastic Indicators that must sit tight for affirmation. Contrasted with traditional oscillators, for example, the Stochastic or RSI, the Sine wave Indicator has two noteworthy focal points.
These are as follows:
1. The Sine wave Indicator envisions the Cycle Mode defining moment as opposed to sitting tight for affirmation.
2.The stage does not progress when the market is in a Trend Mode.
(Downloads - 1459)

Sine wave indicator is a VertexFX handy indicator for detecting cyclical markets and turning points.
Reckoning of cyclic defining moments is a noteworthy point of preference of Sine wave Indicator when contrasted with different oscillators, for example, the RSI and Stochastic Indicators that must sit tight for affirmation. Contrasted with traditional oscillators, for example, the Stochastic or RSI, the Sine wave Indicator has two noteworthy focal points.
These are as follows:
1. The Sine wave Indicator envisions the Cycle Mode defining moment as opposed to sitting tight for affirmation.
2.The stage does not progress when the market is in a Trend Mode.
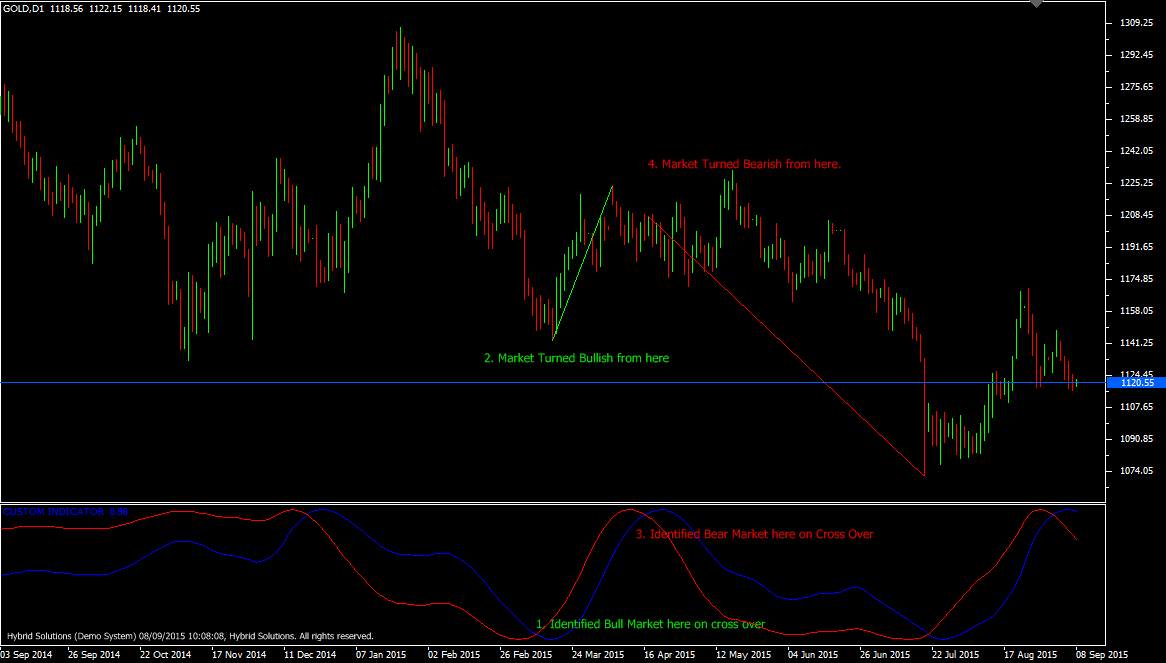
Along these lines, the Sine wave Indicator does not tend to give false whipsaw signals when the market is in a Trend Mode. It lets us know whether we are in a recurrent business sector, and if yes, then the present area inside of the predominant cycle can be recognized. It wavers in the middle of +1.0 and – 1.0. At the point when the marker (blue) is rising easily towards +1.0, coming to top, it suggests that the business sector is coming to its defining moment. In like manner, when the marker (blue) is falling easily towards – 1.0, coming to base, it suggests that the business is coming to its defining moment.. It involves two segments, the fundamental Sine wave pointer (BLUE), which indicates the present area in the business sector cycle. The second segment is the Lead segment, which drives the fundamental Sine wave by 45 degrees, and consequently endeavors to PREDICT when the cycle will end.
The RED line will dependably achieve the extremes to start with, and ordinarily when this happens the market exhibits characteristics of change in market direction, the businesses shows attribute of alter in business sector.
Buy and Sell trades are not generated using the Sine wave indicator. Rather, it is used with other indicators to identify markets which exhibit cyclical and trending characteristics.
Usage
- Download the attachment.
- Copy it to your company VertexFX Local VTL Files folder i.e. C:Program FilesCompany Namevtl10Local VTL Scripts
- Restart your Client Terminal or Right Click on “Local VTL Scripts” Tree Node to find the script.
Additional information
| Plugin-Type | Client VTL – Custom Indicator |
|---|---|
| Compatibility |

