$0.00
In stock
The Breakout indicator is client side VTL indicator used to trade breakouts when the price moves out of a range. It is typically used when the market transit from sideways to trending.
(Downloads - 1446)

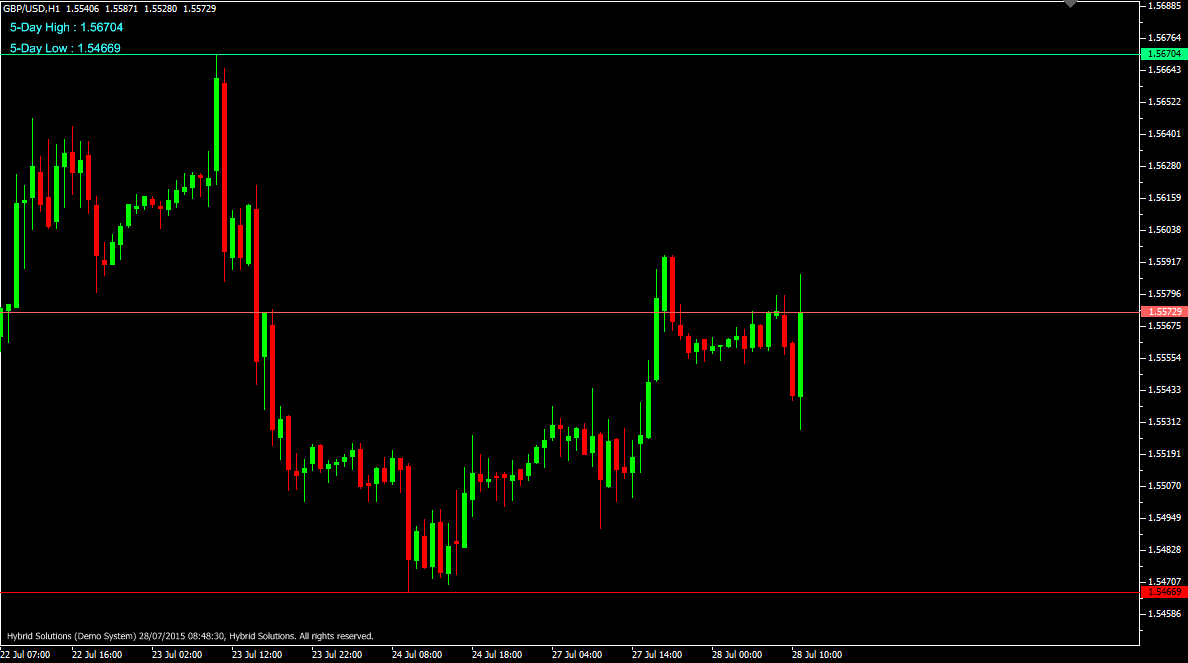
The Breakout indicator is client side VTL indicator used to trade breakouts when the price moves out of a range. It is typically used when the market transit from sideways to trending. The upper GREEN line is the highest High of the recent DAYS candles based on the Daily chart, whereas the lower RED
line is the lowest Low of the recent DAYS candles based on the Daily chart. For example, if DAYS is set to 5, the upper Green line is the Highest High of the recent 5 daily candles, and the lower Red line is the Lowest Low of the recent 5 daily candles.
BUY – Place Buy when price crosses above the upper GREEN line, and set the stoploss at the lower RED line.
SELL – Place Sell when price crosses below the lower RED line, and set the stoploss at the upper GREEN line.
Usage
- Download the attachment.
- Copy it to your company VertexFX Local VTL Files folder i.e. C:Program FilesCompany Namevtl10Local VTL Scripts
- Restart your Client Terminal or Right Click on “Local VTL Scripts” Tree Node to find the script.
Additional information
| Plugin-Type | Client VTL – Custom Indicator |
|---|---|
| Compatibility |

