$0.00
In stock
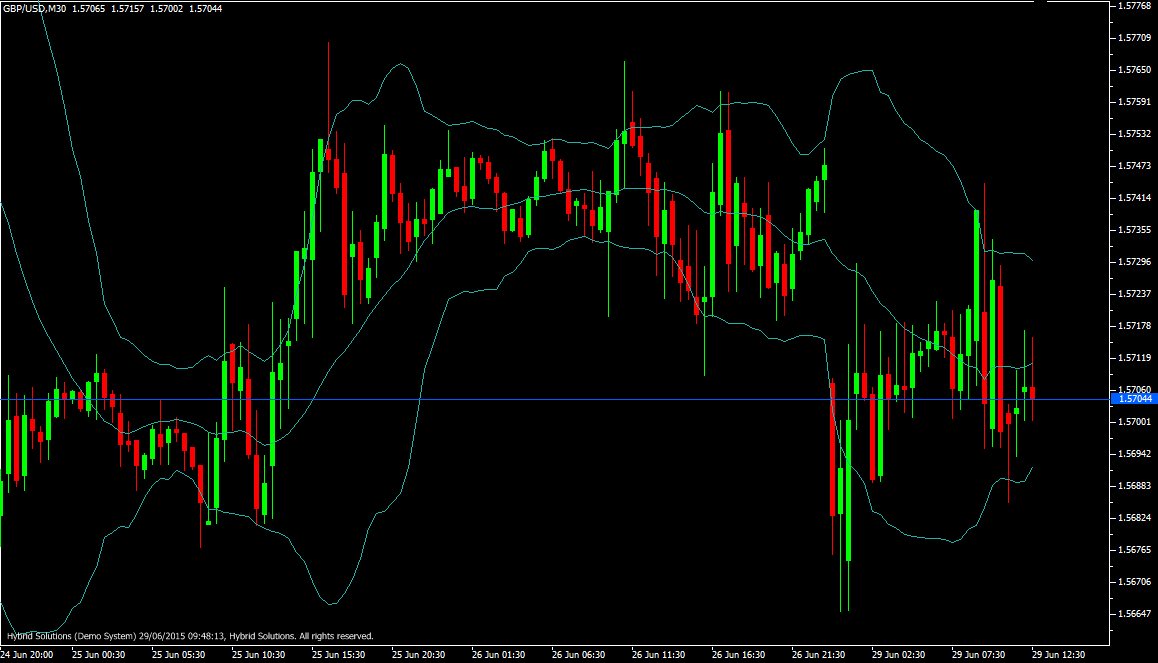
Bollinger Bands are usually plotted on the price chart. Just like in case of the Envelopes, the interpretation of the Bollinger Bands is based on the fact that the prices tend to remain in between the top and the bottom line of the bands.
(Downloads - 1509)

Bollinger Bands are usually plotted on the price chart. Just like in case of the Envelopes, the interpretation of the Bollinger Bands is based on the fact that the prices tend to remain in between the top and the bottom line of the bands. A distinctive feature of the Bollinger Band indicator is its variable width due to the volatility of prices.
In periods of considerable price changes (i.e. of high volatility) the bands widen leaving a lot of room to the prices to move in. During standstill periods, or the periods of low volatility the band contracts keeping the prices within their limits.
Calculation: Bollinger bands are formed by three lines. The middle line (ML) is a usual Moving Average. ML = SUM [CLOSE, N]/N The top line, TL, is the same as the middle line a certain number of standard deviations (D) higher than the ML. TL = ML + (D*StdDev) The bottom line (BL) is the middle line shifted down by the same number of standard deviations. BL = ML — (D*StdDev) Where: N — is the number of periods used in calculation; SMA — Simple Moving Average; StdDev — means Standard Deviation. StdDev = SQRT(SUM[(CLOSE — SMA(CLOSE, N))^2, N]/N) It is recommended to use 20-period Simple Moving Average as the middle line, and plot top and bottom lines two standard deviations away from it. Besides, moving averages of less than 10 periods are of little effect.
Usage
- Download the attachment.
- Copy it to your company VertexFX Local VTL Files folder i.e. C:Program FilesCompany Namevtl10Local VTL Scripts
- Restart your Client Terminal or Right Click on “Local VTL Scripts” Tree Node to find the script.
Additional information
| Plugin-Type | Client VTL – Custom Indicator |
|---|---|
| Compatibility |

