$0.00
In stock
Kairi Indicator is an oscillator like RSI. This VTL script shows overbought/oversold market condition. The indicator oscillates with 0 as midpoint. The Kairi indicator is calculated as the deviation of current price from its moving average.
(Downloads - 1815)
Kairi Indicator is an oscillator like RSI. This VTL script shows overbought/oversold market condition. The indicator oscillates with 0 as midpoint. The Kairi indicator is calculated as the deviation of current price from its moving average.
Extreme Kairi reading above 0 level indicates overbought market situation. Red box in image 1. Extreme readings below 0 level indicates oversold market condition. Blue box in image 1.
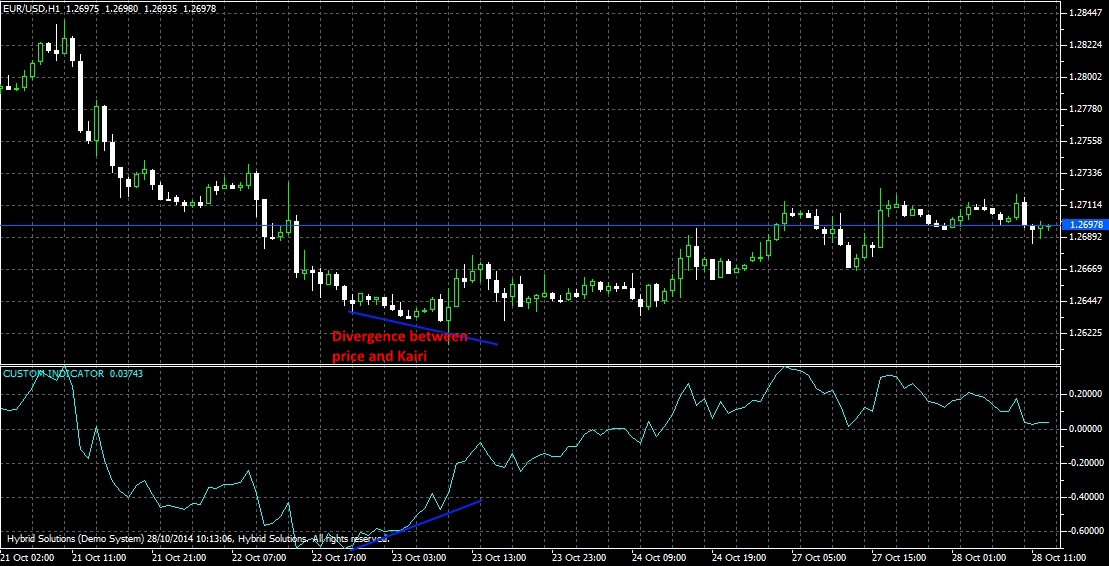
When the market is overbought/oversold, a counter trend move is likely to emerge. In the image, observe the reverse moves after Kairi indicator rises/falls to overbought/oversold levels. Like other oscillators divergence in the indicator value with price is a good indication of trend reversal.

In image 2, divergence in Kairi with price, as price makes new lows is marked and trend reverses upward. The VTL Script implementation has 3 parameters 1. MAperiod : The Moving Average period 2. MAmethod : Moving Average calculation method, Simple, EMA etc. 3. Apply : The price field to apply indicator, it can be close, average price etc.

Usage
- Download the attachment.
- Copy it to your company VertexFX Local VTL Files folder i.e. C:Program FilesCompany Namevtl10Local VTL Scripts
- Restart your Client Terminal or Right Click on “Local VTL Scripts” Tree Node to find the script.
Additional information
| Plugin-Type | Client VTL – Custom Indicator |
|---|---|
| Compatibility |

